Covid-19 Dashboard for San Francisco Bay Area

What was the Project?
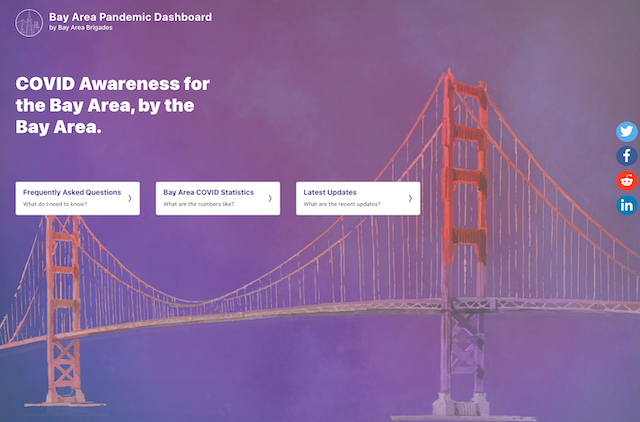
PanDa, the Bay Area Pandemic Dashboard, is a tool available specifically for Bay Area residents. This collaboration between Code for San Francisco, Open Oakland, and Code for San Jose rigorously curates the most complete Bay Area data resource possible while surfacing insights using metrics that directly impact residents’ lives during Covid.
Project members are developing open source web scrapers for capturing data being posted in nine different ways to nine different county websites. Front end contributors are developing beautiful interactive data visualizations designed by UX Design contributors.
What was my role?
I initiated the code base project by folking a similar dashboard repo developed by Code 4 Japan, and customized it for the San Francisco Bay Area. I led the front-end development.
What did I do?
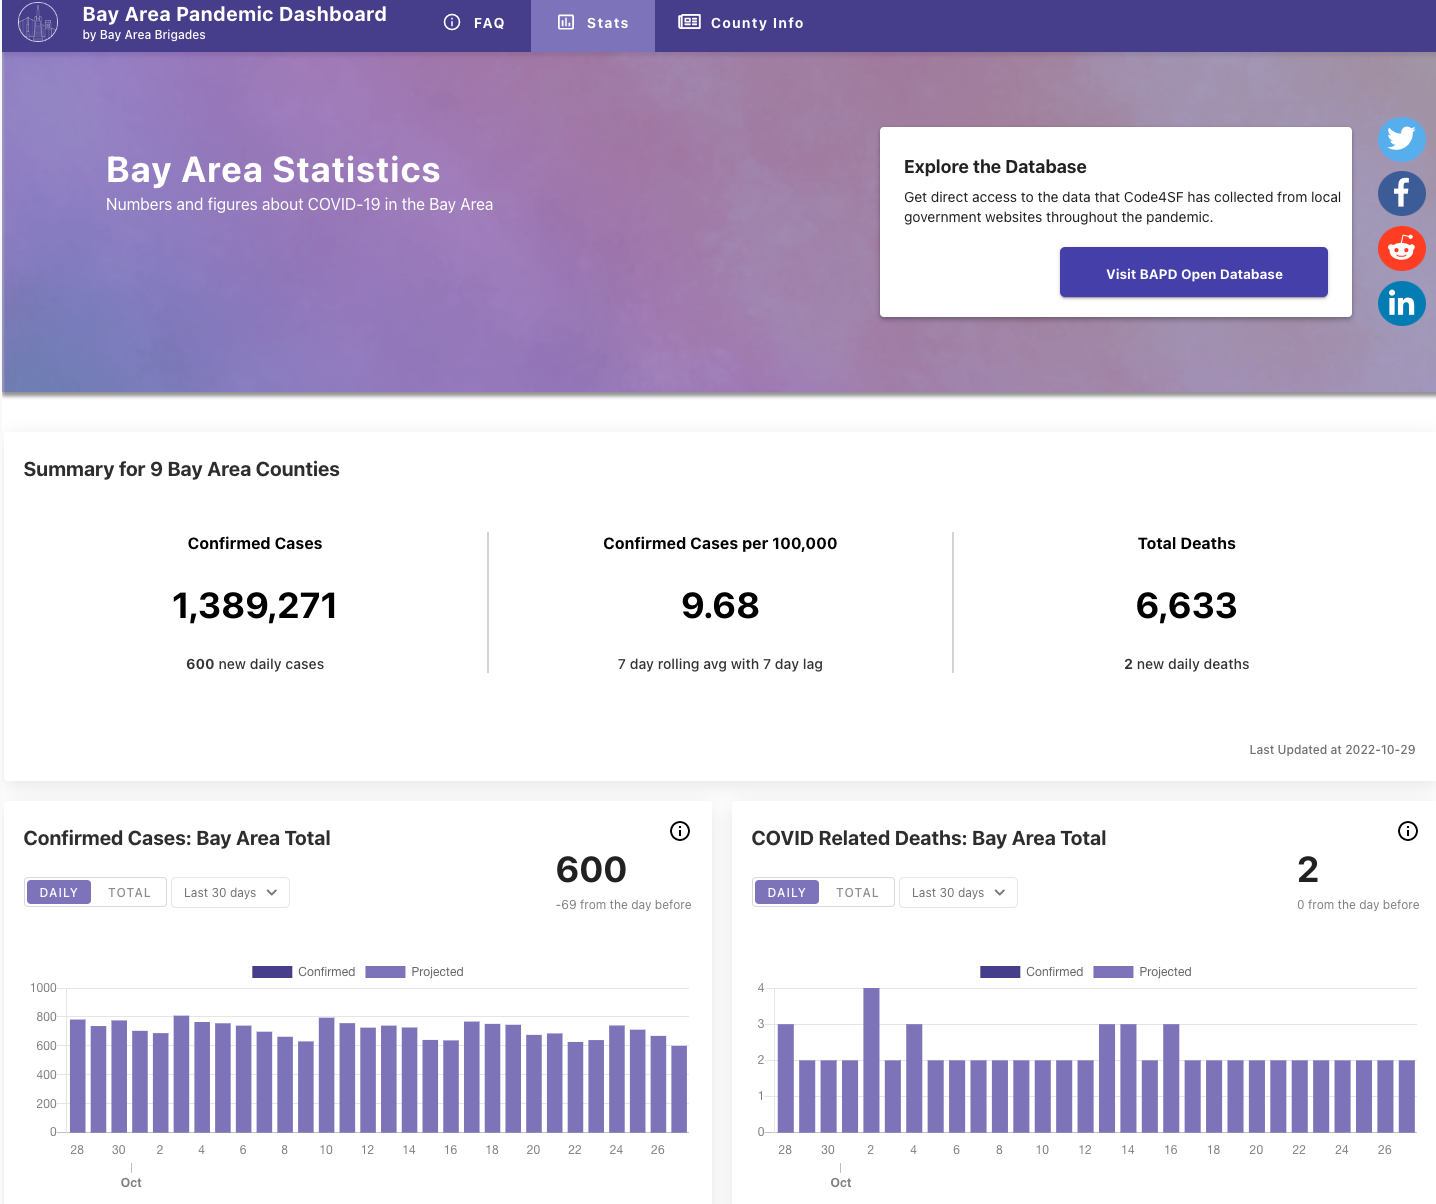
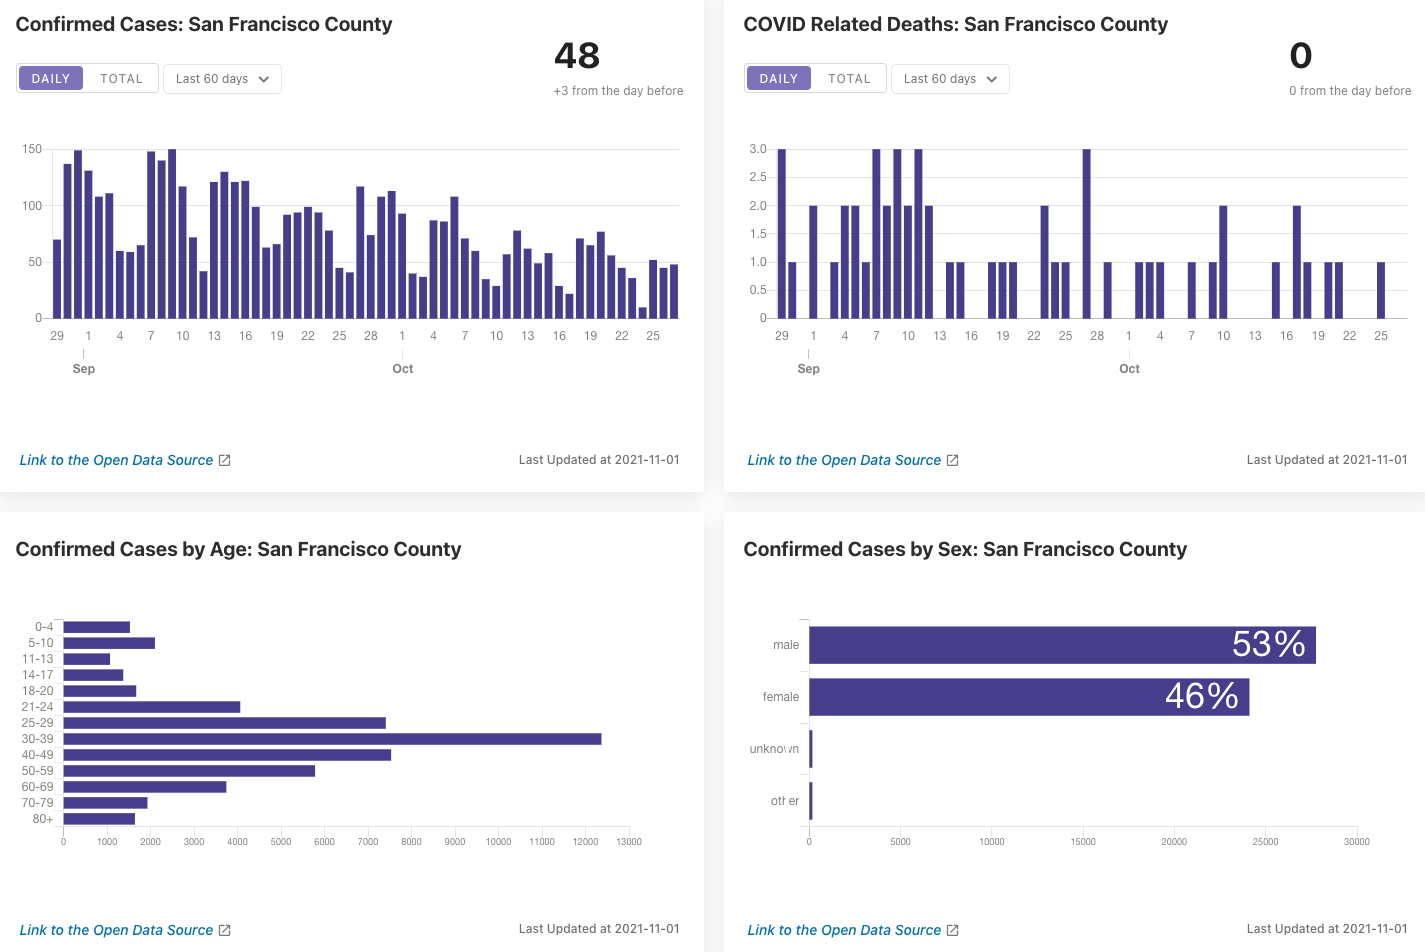
I worked with designers who designed the dashboard wireframe, then implemented it in weekly basis through Civic Hack Nights. I also worked with python engineers who curate realtime data from different sites and data respositories. The fetched data was automatically stored to our repo in daily basis, then visualized on the frontend using chart.js. I implemented majority of the front end code, and in later of the project I mentored new engineers who want to learn coding.
What was the Result?
I setup github action to automatically fetch data every day. As of today in 2022, still the automatic data update is in progress, keeping the data up to date.
Additional Links:
Description


Technology
- HTML/CSS/Javascript
- Vue.js
- Chart.js
- Python
- Github Action
My Role
- Front-end Development